JERICO-S3 provides Virtual Access (VA) to 20 European coastal ocean services. Access to services is free of charge and open to all stakeholders and users.
Alg@line – Real time algal monitoring in the Baltic Sea
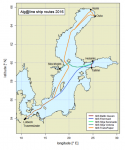
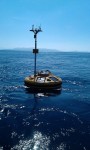
SYKE Alg@line network in the Baltic Sea monitors the state of the sea and detects algal blooms. Several millions of data points are collected annually from the Baltic Sea, using a fleet of ferries operated by shipping companies. Ferries are equipped with flow-through systems (usually called ‘Ferryboxes’) with spatial measurement resolution of about 200 m. The data recording has the geo-reference logging from GPS. Ferryboxes incorporate a thermosalinograph, chlorohyll, phycocyanin and CDOM fluorometers, turbidity meter and refrigerated sampling unit providing discrete water samples for laboratory analyses (e.g. microscopy, FlowCAM, nutrients, optical analysis, and experimental work). Additional flow-through sensors e.g. for primary production (FRRF) and light reflectance are used periodically,
Data is visualized in SYKE webpage and in Järviwiki (alias Lakewiki)which is a web service built and maintained in cooperation by authorities and common people. Data may be downloaded through Emodnet and CMEMS
AquaDocs
AquaDocs is the joint open access repository of the UNESCO/IOC InternationaI Oceanographic Data and Information Exchange (IODE) and the International Association of Aquatic and Marine Science Libraries and Information Centers (IAMSLIC) with support from the FAO Aquatic Sciences and Fisheries Abstracts. It is a thematic repository covering the natural marine, coastal, estuarine/brackish and fresh water environments and includes all aspects of the science, technology, management and conservation of these environments, their organisms and resources, and the economic, sociological and legal aspects.
BHFR
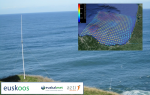
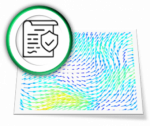
This HF radar system is composed by two CODAR Seasonde antennas (transmit frecuency 4.525 MHz) and offers many benefits for the Basque Operational Oceanography Network such as: the improvement of the knowledge about surface currents and their forcing physical processes, marine safety, search and rescue, pollution response, validation and calibration of both hydrodynamic and pollutant drift forecasting models, data assimilation on progress, etc. The access from raw radial data to processes 2D surface current is provided for scientific and applied purposes (Coastal processes, marine safety, search and rescue, pollution response, etc).
Cefas Data Hub
CefMAT is a web-based marine assessment tool platform to address policy questions. Users can efficiently produce high quality visualisations and summary statistics tailored to their queries. It also gives access to specific products created under CMEMS and visualisation of aggregated DOI biological datasets from Cefas Data Hub. Services currently offered by the infrastructure include the following: the Marine Online Assessment Tool to find out the UK’s progress towards Good Environmental Status; the Cefas science dashboard to find out the latest in Cefas’ marine science and the development of innovative monitoring techniques and assessment methodologies, and the Atlantic Assessments to discover assessments of the Northeast Atlantic based on satellite and modelling outputs data from CMEMS.
COSYNA
COSYNA provides near real-time data from integrated observations and model results. The observations comprise a variety of in situ techniques (e.g. FerryBox, Cabled Underwater Observatories) as well as remote sensing from shore by radar and from space by satellite. Key physical, sedimentary, geochemical and biological parameters are observed at high temporal resolution in the water column and the upper and lower boundary layers.
COSYNA’s modelling part consists of nested models with different grid sizes for hydrography (salinity, waves, currents), for suspended matter and for biogeochemical and ecosystem processes. Sophisticated data assimilation procedures, i.e. continuous corrections of the models by observations, improve the reliability of now-casts and short-term forecasts. All data and plots are generally available for download and visualization (FAIR) through the data portal.
In addition FerryBox ship of opportunity data can be accessed via the data portal where different visualizaton tools are available (e.g. single transect, pool data along a certain transect for a longer time period or time-series at certain locations). Furthermore, all datasets can be exported in ASCII (tab separated tables) or NetCDF format and downloaded.
COSYNA’s motivation is bridging the gap between operational oceanography and the various users of forecasts of the marine state. For further outreach to stakeholders and the wider community a web app has been developed. This data are also available as an app for the most common platforms.
EcoTaxa
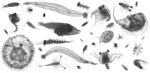
EcoTaxa is a web application where users can (i) upload and host images of individual objects, (ii) name them according to a universal taxonomy with the help of advanced machine learning algorithms, and (iii) export the resulting ecological data in standard and easy to use formats, for scientific exploitation and dissemination. It is currently massively used for images collected by quantitative plankton imaging instruments.
EU HFR NODE / CNR eInfrastructure
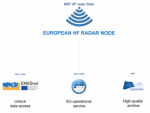
The European High Frequency Radar Node (EU HFR Node) was established in 2018 by AZTI, CNR-ISMAR and SOCIB, under the coordination of the EuroGOOS HFR Task Team, as the focal point and operational asset in Europe for HFR data management and dissemination, also promoting networking between EU infrastructures and the Global HFR network. The EU HFR Node is fully operational since December 2018 in distributing tools and support for standardization to the HFR providers as well as standardized Near Real Time (NRT) and Delayed-Mode (DM) HFR radial and total current data to CMEMS-INSTAC, EMODnet Physics and SDC Data Access. The EU HFR Node is managing data from European HFR networks and integrates and delivers US HFR network data to the aforementioned data portals. In particular, the EU HFR Node implements the functions of data acquisition and harvesting, QC, validation/assessment, NRT data delivery and historical data distribution with different reprocessing levels.
The core of this service consists in the continuous development of the data model and the processing standards through discussion with operators, providers, distributors and international experts. Based on this, the EU HFR Node maintains and updates manuals, procedure guidelines and software tools, and pushes them towards the HFR operators, providers and managers via repositories and training workshops. In particular, the software tools for processing native HFR data for QC and converting them to the standard format for distribution are continuously made available to HFR operators via public GitHub repositories and releases with DOI assigned.
The data processing and distribution service is founded on a simple and very effective rule: if the data provider can set up the data flow according to the defined standards, the node only checks and distributes the datasets. If the data centre cannot set up the data flow, the EU HFR Node directly harvests the raw data from the provider, harmonizes, quality-controls and formats these data and makes them available to the marine portals. The strength and flexibility of this solution reside in the architecture of the European HFR node, which is based on a centralized database, fed and updated by the operators via a webform. The database contains updated metadata of the HFR networks and the needed information for processing/archiving the data.
The guidelines on how to set the data flow from HFR providers to the EU HFR Node are thoroughly described in DOI:10.25704/9XPF-76G7.
HFR-TirLig
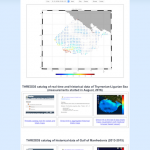
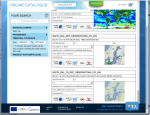
Surface current data measured by the CNR-ISMAR HF radar network in the North Western Tyrrhenian Sea and in the Ligurian Sea are made available in graphical format for the last 48 hours and in real time and delayed mode via a THREDDS catalog which provides metadata and data access. The web site gives information on HF radar technology, sites position and operational parameters, and links to the THREDDS catalog. The catalog contains HF radar data in netCDF format according to the European standard data model and offers different remote-data-access protocols such as Open-source Project for a Network Data Access Protocol (OpenDaP), Web Coverage Service (WCS), Web Map Service (WMS) (OGS standards), as well as pure HTTP or NetCDF-Subsetter. They allow for metadata interrogation and data download (even sub-setting the dataset in terms of time and space) while embedded clients, such as GODIVA2, NetCDF-JavaToolsUI and Integrated Data Viewer, grant real-time data visualization directly via browser and allow for navigating within the plotted maps, saving images, exporting-importing on Google Earth, generating animations in selected time intervals. The data on the THREDDS catalog are accessible both in aggregated and in non-aggregated configuration.
The data set consists of maps of radial and total velocity of the sea water surface current collected by the HF radars in the North Western Tyrrhenian Sea and in the Ligurian Sea. Surface ocean velocities estimated by HF Radar are representative of the upper 0.3-2.5 meters of the ocean. The radar sites are operated according to Quality Assessment procedures and data are processed for Quality Control. Data access tools are compliant to Open Geospatial Consortium (OGC), Climate and Forecast (CF) convention and INSPIRE directive. The use of netCDF format allows an easy implementation of all the open source services developed by UNIDATA.
In the same area covered by the HF radar network, data from Acoustic Doppler Current Profiler installed on the Corsica Channel mooring (platform proposed within the JERICO-S3 TNA) are made available.
IOW
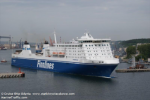
The Leibniz Institute for Baltic Sea Research Warnemünde (IOW) is operating a system for measuring trace gases (pCO2, pO2, CH4, N2O, δ13CCO2) on the ferry Finnmaid using two independent equilibrator/auxiliary equilibrator units with two independent measurement loops of CH4/CO2 and CO/N2O (loop 1) and d13C-CO2 and CO2 (loop 2). The Finnish ship of the Finnlines shipping company crosses the central Baltic Sea along the Travemünde – Helsinki route about every 2 days. Continuous measurement of carbon dioxide partial pressure (pCO2) in the surface water of the Baltic Sea started as an extension of the ALG@LINE project (SYKE, Helsinki) in 2003. Since then, the fully automated equilibration facility has been extended step by step over the years to include further parameters and measurement methods. The line has exceptional importance in bridging the gap between land and ocean observations. Due to the strong changes in the Baltic Sea ecosystem caused by anthropogenic influences (eutrophication, warming), which have already been recorded over several decades, it is particularly suitable for investigating the effects of changed use or adopted environmental strategies on trace gas fluxes.
JRadar
Radar Toolbox for converting CODAR TUV and RUV native files to the NetCDF European HFR Standard. This Toolbox, provided by the European HFR Node, is developed to be run at operator level.
KKOBS
The marine component of the Estonian Environmental Observatory is part of the Gulf of Finland Pilot Supersite in JERICO. The observatory is composed of fixed coastal sensors (sea level), Tallinn-Helsinki ferrybox system, Keri cabled profiling system, portable profiling systems, wave buoy, research vessel surveys. The observatory addresses the main environmental challenges in the area, such as eutrophication and its consequences, climate change effects, microplastic pollution etc. Likewise, observations provide data to the physical oceanographers dealing with the water column dynamics, coastal-offshore exchange, etc. and marine ecologists studying water column and benthic habitats. Observatory collects long-term time-series for the climate and marine system change studies and high-resolution data for the process studies.
LISIC clusTools
Mawenzi is a tool center with R-packages and their RShiny graphical user interfaces for data interpretation, from data completion to data prediction.
RClusTool: Clustering and Classification Tool, with Visualisation and Labelling Features. R-package and its GUI are well adapted to clustering, insert expert knowledge in this clustering as label or pair constraints (these objects must be linked or not linked). Flow cytometry data with pulse signals and/or features could be used with an image visualisation to help in the expert classification step. But it is generalised to any dataset with at least feature input. This package is developed by LISIC-ULCO (Pierre-Alexandre Hébert, Emilie Poisson) in collaboration with CNRS-LOG (Luis Felipe Artigas).
uHMM: Unsupervised Hidden Markov Model, automatic segmentation of time series. This R-package and its GUI are well adapted to segment times series in recurrent and rare/extreme events and to model their dynamics. It offers many data exploration, visualisation reports for data managers and stakeholders. Marine time series from fixed or mobile buoys could be used. A MAREL Carnot data sample is provided in this tool for application.
sClust: Spectral Clustering toolbox and GUI allow to detect populations or events with a scalable point of view from several state-of-art clustering algorithms with spectral clustering focus.
Marine time series or dataframe could be used.
DTWBI: Univariate signal – Dynamic Time Warping based Imputation, filling large gaps within time series. DTWBI is a R package to complete time series where a cause-effect relationship exists within the dynamics process. It is well adapted to large gap (no-consecutive values) and time series with low auto-correlation.
MDA
The Marine Data Archive (MDA), developed by VLIZ, is a secure, online system where researchers can archive their data files in a well-documented manner. The MDA holds data from a wide range of international, European and Flemish projects. It is free for anyone to use: to archive and manage their data, as a personal, project, or institutional archive, and as an open repository for data publication. Data of any type, raw, processed, structured, data products, documents or images can be archived in the MDA. Data in the MDA are made public by linking them to the Integrated Marine Information System (IMIS), or to any other catalogue. It is registered as a repository in https://fairsharing.org/ DOI: 10.25504/FAIRsharing.CjHLQw
MONIZEE

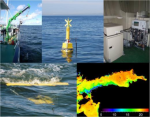
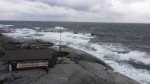
The HIDROGRAFICO+ MSDI portal provides to general users the access to data collected by MONIZEE infrastructure, the real-time monitoring infrastructure for the Portuguese waters that is operated by Instituto Hidrografico. The MONIZEE infrastructure comprises real-time monitoring capacities installed offshore the Portuguese mainland and the Azores and Madeira Archipelagos. MONIZEE offers unique capacities for the monitoring of the Portuguese coastal ocean in particular in the area that extends for more than 700km along the Portuguese mainland, covering the Gulf of Cadiz waters (offshore the southern Portuguese coast) and the energetic conditions affecting the western Portuguese margin. In this area the users accessing HIDROGRAFICO+ portal will get access to (a) data from 5 multiparametric buoys including meteorological parameters, wave measurements, upper 90m ADCP current profile, near surface temperature, subsurface temperature at selected depths (for some of the buoys); (b) surface currents from 6 HF radar stations which cover the complete southern Portuguese margin, the Lisbon bay area and the northwestern Portuguese area; (c) sea surface height from 17 tide gauges stations along the Portuguese mainland coast (some only in graphic format) and (d) wave measurements in 3 wave buoys located along the southern (1) and western (2) Portuguese margin (in graphical format).
The HIDROGRAFICO+ portal offers a platform for data dissemination that follows the main guidelines of the INSPIRE Directive and is based on a MSDI environment that allows the user to select the existent infrastructures in a georeferenced environment. The portal provide an easy access to the broad range of data collected by the MONIZEE system (both real-time quality controlled data as well as archived processed and QC data) in the Portuguese coastal ocean waters which is complemented with numerical modelling products such as operational forecasts. The MONIZEE infrastructures contributes to JERICO-RI and integrates the Iberian Atlantic Margin Integrated Regional Site that is being developed under the JERICO-S3 project.
NorFerry
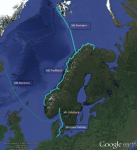
The Ferrybox installation provide the core sensor data from about 4 meters depth of temperature, salinity, Chl-a fluorescence, oxygen and turbidity. Some ships will also provide data on parameters, ocean colour and true wind. Special sampling can be ordered.
Researchers are invited to conduct research from NorFerry data on eutrophication, biodiversity, chemistry, biogeochemistry and remote sensing. The users will be given access to sensor data measured on-board and that are on-line after the QC has been performed on the core sensor and biogeochemical data when available. Data will be uploaded daily (near real-time) to weekly/biweekly. The user can access support from NIVA researchers/technical staff.
 JERICO-Next KOM WP6 Observatory Template NIVA Norferry Final (956.5 KiB)
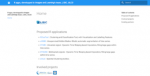
OBPS
OBPS: Ocean Best Practices System aims to accelerate the interoperability of observations, convergence of methodologies, and conventions across ocean communities into trusted, transparently-developed, context-sensitive best practices and standards by facilitating:
(1) trusted protocols for creation, convergence and endorsement of best practices and other standard methodologies,
(2) interoperability across all dimensions of ocean stakeholders’ needs through propagation and linking of best practices, data and standards, and
(3) broad community engagement with sharing methods, creation and adoption of best practices and capacity development in their use.
The OBPS collection of practices and methods cover all disciplines of ocean science, data management and applications, end-to-end from observations to applications and sustained collections based on open (FAIR) principles. The repository is a target resource for JERICO-CORE and also for the developing prototype Ocean Data and Information System (ODIS)/Ocean InfoHub). The repository’s content is indexed by all the major search engines and harvested by such services as Google Scholar, Scopus, OpenAIRE, ASFA, etc. To support such discovery services, advanced natural language technology has been incorporated into the repository to improve coherent discovery of documents with diverse formats. Search and automated semantic indexing capabilities using authorized vocabularies, are extended into the text within each document to tag words and phrases via text mining and natural language processing techniques.. The repository assigns Digital Object Identifiers (DOI) to submitted best practices or uses DOIs already assigned.”
OTGA
OceanTeacher Global Academy provides a comprehensive web-based training platform that supports classroom training (face-to-face), blended training (combining classroom and distance learning), and online (distance) learning.
OceanTeacher Global Academy courses cover a range of topics related to the IOC programmes, contributing to the IOC Mandate and the implementation of the IOC Capacity Development Strategy, enabling equitable participation of all IOC Member States and IOC Programmes.
POSEIDON
The data recorded by the oceanographic platforms operate in the Aegean and the Ionian Seas (fixed stations, ferry box system, gliders) are released through the POSEIDON portal. Physical and biochemical parameters of the marine environment as well as atmospheric parameters in the fixed station locations are available both in real time and delayed mode. The forecasting module of the POSEIDON system consists of four numerical models that provide in daily basis forecasts regarding the atmospheric, sea state, hydrodynamic and ecological conditions of the Eastern Mediterranean. The online POSEIDON database contains the data recorded by the insitu platforms offering also downloading functions for the whole data set, while a user-friendly tool is also available for accessing the results of all the forecasting models for the last five years.
SHARK and Open Data
SHARK Marine environmental monitoring data is available in delayed mode.
The data can be accessed through SHARKweb via downloading or directly via the web service SHARKdata .
All data are available for download.
Öppna data (Open data) contains marine physical data from e.g. fixed platforms, tidal gauges, buoys, ferry box systems and meteorological stations. Near Real Time mode.
All data are available for download.
SOCIB Data Repository
The Balearic Islands Coastal Observing and Forecasting System (SOCIB) is a Unique Scientific and Technical Infrastructure (ICTS) that operates a coastal ocean observing and forecasting system, a scientific and technological infrastructure providing free, open, quality-controlled, validated, and timely streams of oceanographic data, as well as data stewardship and long-term preservation.
SOCIB offers an Open Access Data Repository critical for oceanographic research. The repository contains a wide range of Essential Ocean Variables (EOVs) covering from physics (sea water temperature, sea water salinity, currents, sea surface height, etc.) to biochemistry (nutrients, oxygen, turbidity, etc.) and biology (chlorophyll mass concentration, etc.). In addition to those, it is possible to find also related meteorological variables (atmospheric pressure, wind velocity, and direction, air temperature, and humidity, etc.).
This data, either reported by observing facilities (oceanographic buoys, drifters, profilers, gliders, high-frequency radars, etc.) or outputted by hydrodynamical (WMOP), wave (SAPO), or meteorological (BRIFS) numerical models, facilitates the monitoring and forecast of the ocean state and variability in the frame of a number of projects and observation programmes with a particular focus on the Western Mediterranean Sea.
Following the FAIR principles (Findable; Accessible; Interoperable; Re-usable) for scientific data management, a number of protocols and applications have been set up for the users to access the SOCIB Data Repository. In addition, this data is also exposed through the DIGITAL.CSIC repository.
Utö
The Utö Atmospheric and Marine Research Station of Finnish Meteorological Institute is located on Utö Island (59º 46’50N, 21º 22’23E) at the outer edge of the Archipelago Sea, Baltic Sea. Utö site specific open data is available at https://swell.fmi.fi/Uto/. Operational meteorological and marine observations, and model data produced at FMI is available through open data portal (https://en.ilmatieteenlaitos.fi/open-data).