July 4th, 2013: JERICO TNA GESEBB glider Mission started in front of Cape Matxitxako, in the southeastern Bay of Biscay.
July 5th, 2013: Mission temporary suspended due to a leak occurred inside the digifin that run inside the cables of the antennas; glider was safely recovered near the deployment position.
July 23rd,2013: Re-start of the GESSEB glider mission.
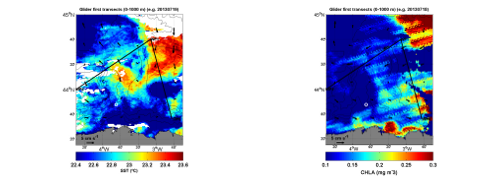
The GESEBB glider mission (http://www.jerico-fp7.eu/) of the first TNA call of Jerico re-started on 23 July, 2013 The deep glider mission will cover the southeastern Bay of Biscay (from 43N to 45ºN and from 2.5ºW to 4.5ºW), during 2 months (until end of September 2013). During approximately 12 days, the glider will first perform two exploratory transects, covering a distance of 300 km approximately from the sea surface to a maximum depth of 1000 m. After that and depending on the observations, the rest of the campaign (48 days) will be redefined.
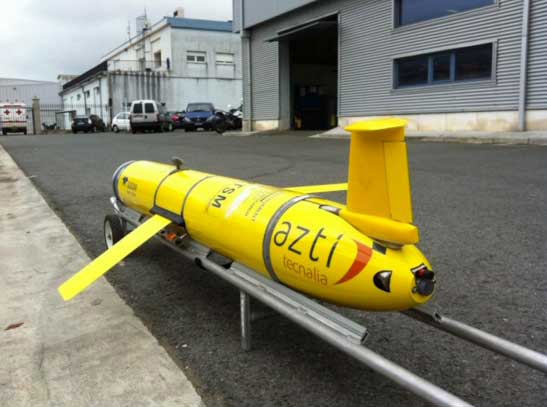
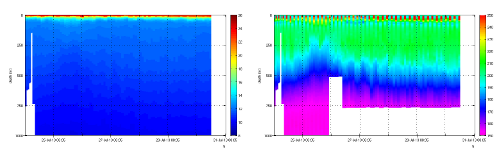
CAMPE is a Slocum-1000 type glider; it is part of the fleet operated by the INSU-CNRS (La Seyne-sur-Mer (France); http://www.dt.insu.cnrs.fr/gliders/gliders.php). It is equipped with a CTD (conductivity, temperature and pressure), dissolved oxygen, and fluorescence-turbidity sensors. Data measured will be transmitted via Iridium in order to check the overall status of the instruments (sensors, battery…) and the navigation behaviour, and to send the scientific measurements. Real time data transmission will be done at every surfacing event, at least every 4 hours. The glider track and its near real time position can be checked in the EGO-network webpage http://glider83a.dt.insu.cnrs.fr/.
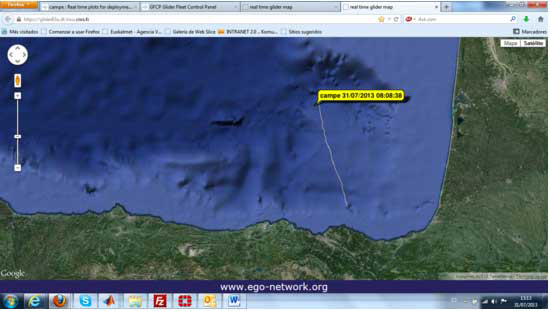
In addition, in the EGO-network the measurements and technical information of the glider are continuously updated (http://www.ego-network.org).
The objective of the mission is sampling the characteristics of a mesoscale eddy that appears in the southeastern Bay of Biscay, during spring and summer. The origin of this structure is associated with the strength and extension of a winter warm flow on the cantabrian slope. Since this eddy is retained in the study area during months, it is expected that during July-August 2013 it will be close to the position observed in the previous figures. The following map shows the location of this structure on 8 July 2008. The purple arrows represent transects first proposed for the mission.
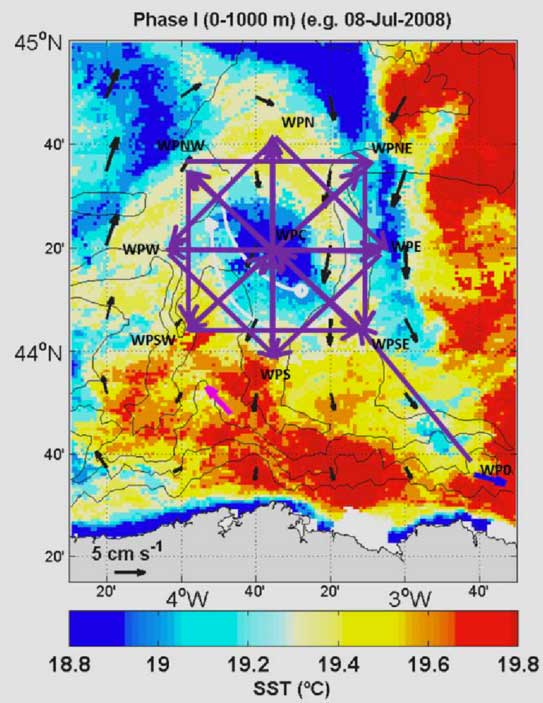
Since a previous monitoring of this structure doesn’t ensure the presence of this type of anticyclonic eddy in the area, and as stated before, the mission will start with 2 exploratory transects. The campaign has begun in the Matxitxako offshore buoy (WP0: 43.6ºN 2.69ºW). This buoy belonging to Meteorology and Emergencies Directorate of the Basque Government (http://www.euskalmet.euskadi.net/) is equipped with a chain of CTD and a downward looking ADCP (interesting for data inter-comparison). Finally, in parallel to the glider mission 2 drifting buoys will be deployed in the centre of the eddy. These drifters will have a holey sock drogue centred at 50 m depth. The position will be transferred by an ARGOS localisation system. These drifters will be deployed by means of one vessel of the Spanish Maritime Safety Agency (SASEMAR: http://www.salvamentomaritimo.es/).
The experiment will permit to know in detail the vertical structure of the eddy and its evolution during the two months of the campaign. If the stationary eddy is not sampled, both because it has not been developed or because we are not able to locate it correctly from remote sensing maps, the campaign will permit to sample in detail the vertical structure of the water column (stratification, thermocline…) over the shelf-slope area in a period which is especially interesting regarding the biological cycle of some of the key species for the fishery activity.
By Ainhoa Caballero(1), Anna Rubio(1), Julien Mader(1), Carlos Hernandez(1), Laurent Beguery(2) and Pierre Testor(3).
-
Marine Research Division, AZTI-Tecnalia, Pasaia, Spain.
-
INSU-CNRS, La Seyne-sur-Mer, France.
-
LOCEAN-IPSL, Paris, France.