IN JERICO-Next novel instrumentation of observing phytoplankton diversity, algal blooms etc. are used in work packages three and four (WP3&WP4). There are activities in the Baltic Sea, the Kattegat-Skagerrak, and the North Sea-English channel and in the western Mediterranean Sea. In the Skagerrak area east of the North Sea a study of algal blooms and the diversity of phytoplankton have been carried out August to October 2016. One goal of the study is to increase the understanding on how algal blooms develop and how weather and ocean currents influence bloom development. The study was carried out near a mussel farm by SMHI and several other JERICO partners. Also scientists from the University of Gothenburg, Sweden, and Alfred Wegener Institute in Germany took part in the study. Automated instruments and samplers were deployed in situ for continuous measurements and manual water sampling was made weekly.
 |
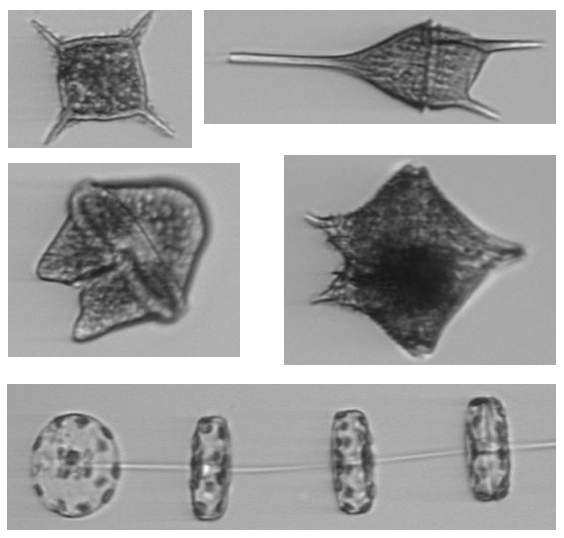 |
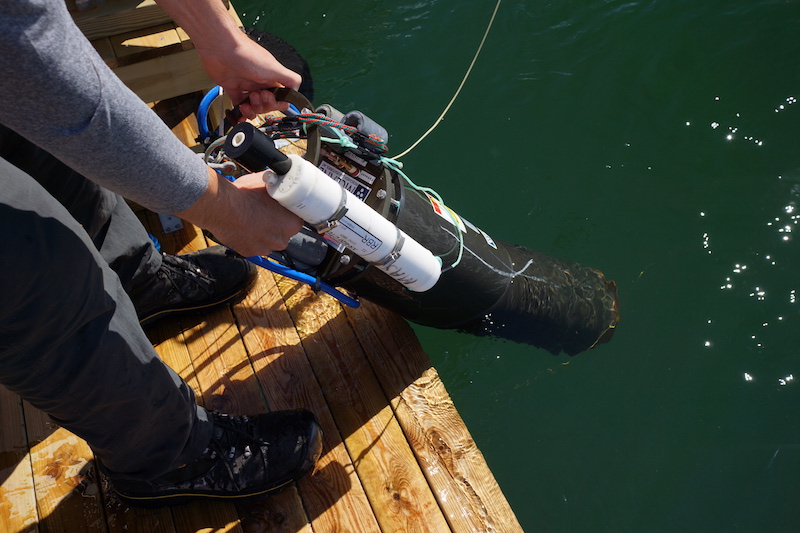
Fig. 1. The Imaging FlowCytobot (IFCB), a type of automated underwater microscope, was used to enumerate and identify plankton. The instrument collects and analyses samples every 25 minutes. It was deployed in situ in a depth profiling mode. Images from the IFCB on the right show a silico-flagellate (top left), dinoflagellates and a diatom chain (bottom). Photo by Bengt Karlson.
 |
 |
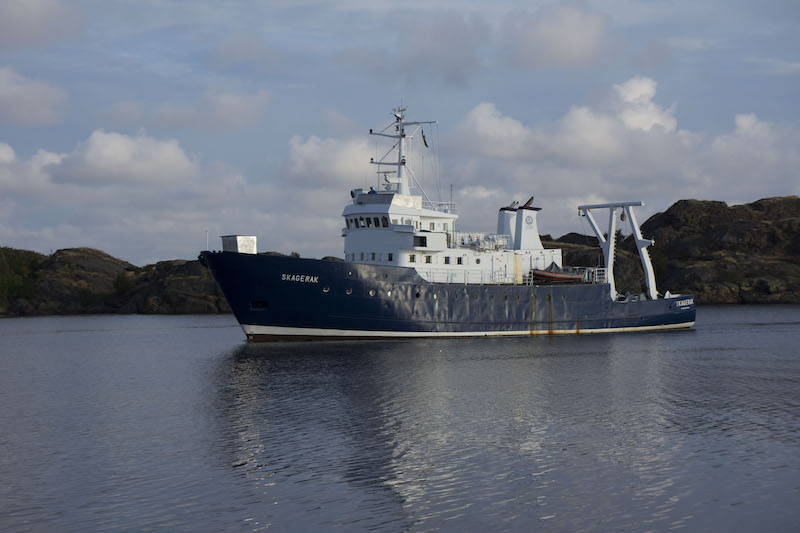 |
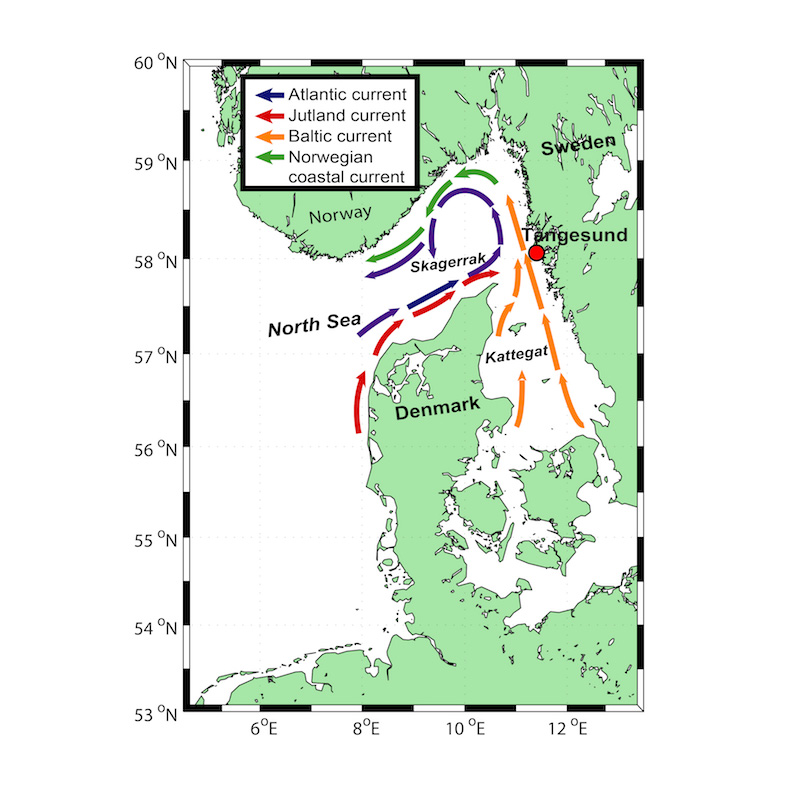
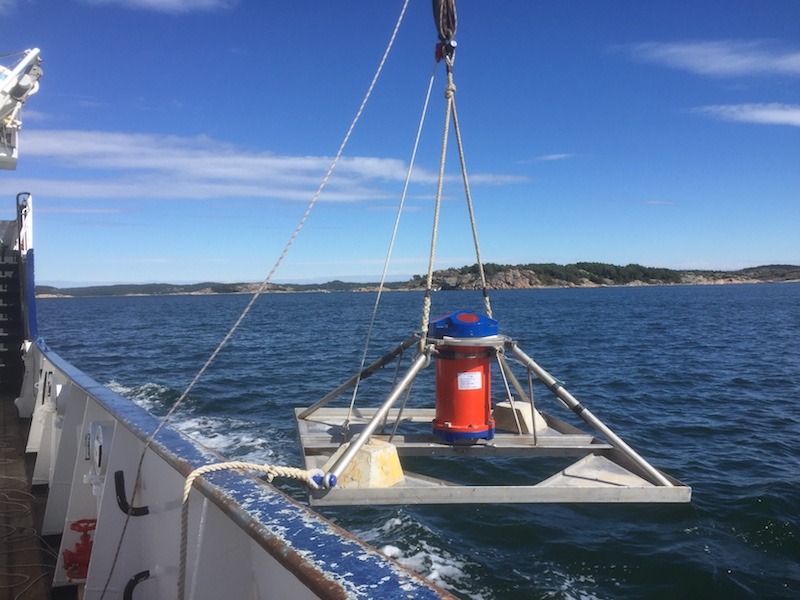
Fig. 2. Left: Study area, top right: an ADCP current meter and bottom right the R/V Skagerak. Photos by Lars Arneborg and Bengt Karlson.
In addition to the biological data collected sea currents and the water column stratification was investigated. CTD-casts from the research vessel were made to measure salinity, temperature and chlorophyll fluorescence. Current meters (ADCP) and salinity and temperature sensors were deployed for about three months. The data collected will be used together with modelling to describe bloom development.
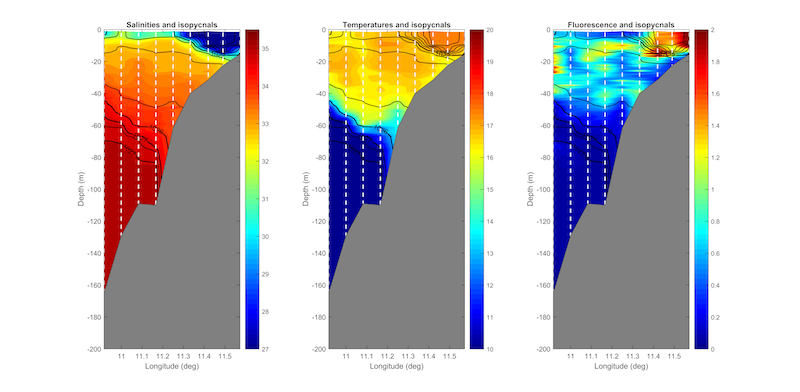
Fig. 3. Left: The water column structure along an east-west transect along 58° from the Swedish coast (right) towards the North Sea (left). During this cruise on September 6th southerly and westerly winds had pushed the surface water towards the Swedish coast. The separate graphs are left: salinity, middle: temperature and right: chlorophyll fluorescence.