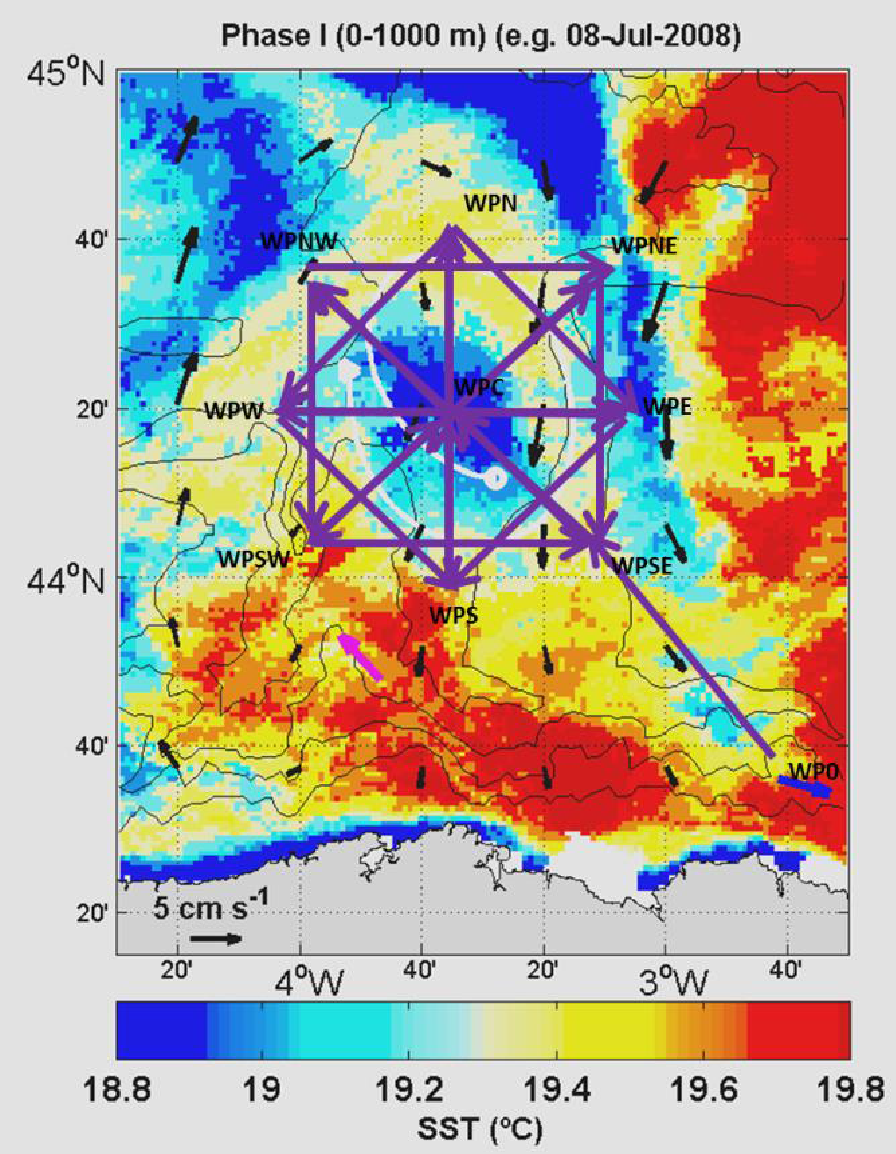
Figure 3. Sea surface temperature map of the study area on 8 July 2008, with geostrophic currents (black arrows) and the trajectory of a drifter located area during that date (white arrow).
Figure 3. Sea surface temperature map of the study area on 8 July 2008, with geostrophic currents (black arrows) and the trajectory of a drifter located area during that date (white arrow).
Necessary cookies are absolutely essential for the website to function properly. These cookies ensure basic functionalities and security features of the website, anonymously.
| Cookie | Duration | Description |
|---|---|---|
| __cfduid | 1 month | The cookie is used by cdn services like CloudFare to identify individual clients behind a shared IP address and apply security settings on a per-client basis. It does not correspond to any user ID in the web application and does not store any personally identifiable information. |
| _GRECAPTCHA | 5 months 27 days | This cookie is set by Google. In addition to certain standard Google cookies, reCAPTCHA sets a necessary cookie (_GRECAPTCHA) when executed for the purpose of providing its risk analysis. |
| ASP.NET_SessionId | This cookie is used in sites developed with Microsoft.Net. When a user start browsing a unique session ID is created, which keeps track of all the information regarding that session.This information is stored in the web server and it is identified via a GUID.The GUID is essential for any ASP.NET site to function properly. | |
| cookielawinfo-checbox-analytics | 11 months | This cookie is set by GDPR Cookie Consent plugin. The cookie is used to store the user consent for the cookies in the category "Analytics". |
| cookielawinfo-checbox-functional | 11 months | The cookie is set by GDPR cookie consent to record the user consent for the cookies in the category "Functional". |
| cookielawinfo-checbox-others | 11 months | This cookie is set by GDPR Cookie Consent plugin. The cookie is used to store the user consent for the cookies in the category "Other. |
| cookielawinfo-checkbox-advertisement | 1 year | The cookie is set by GDPR cookie consent to record the user consent for the cookies in the category "Advertisement". |
| cookielawinfo-checkbox-necessary | 11 months | This cookie is set by GDPR Cookie Consent plugin. The cookies is used to store the user consent for the cookies in the category "Necessary". |
| cookielawinfo-checkbox-performance | 11 months | This cookie is set by GDPR Cookie Consent plugin. The cookie is used to store the user consent for the cookies in the category "Performance". |
| JSESSIONID | session | Used by sites written in JSP. General purpose platform session cookies that are used to maintain users' state across page requests. |
| PHPSESSID | session | This cookie is native to PHP applications. The cookie is used to store and identify a users' unique session ID for the purpose of managing user session on the website. The cookie is a session cookies and is deleted when all the browser windows are closed. |
| viewed_cookie_policy | 11 months | The cookie is set by the GDPR Cookie Consent plugin and is used to store whether or not user has consented to the use of cookies. It does not store any personal data. |
Functional cookies help to perform certain functionalities like sharing the content of the website on social media platforms, collect feedbacks, and other third-party features.
Performance cookies are used to understand and analyze the key performance indexes of the website which helps in delivering a better user experience for the visitors.
| Cookie | Duration | Description |
|---|---|---|
| YSC | session | This cookies is set by Youtube and is used to track the views of embedded videos. |
Analytical cookies are used to understand how visitors interact with the website. These cookies help provide information on metrics the number of visitors, bounce rate, traffic source, etc.
Advertisement cookies are used to provide visitors with relevant ads and marketing campaigns. These cookies track visitors across websites and collect information to provide customized ads.
| Cookie | Duration | Description |
|---|---|---|
| IDE | 1 year 24 days | Used by Google DoubleClick and stores information about how the user uses the website and any other advertisement before visiting the website. This is used to present users with ads that are relevant to them according to the user profile. |
| test_cookie | 15 minutes | This cookie is set by doubleclick.net. The purpose of the cookie is to determine if the user's browser supports cookies. |
| VISITOR_INFO1_LIVE | 5 months 27 days | This cookie is set by Youtube. Used to track the information of the embedded YouTube videos on a website. |
Other uncategorized cookies are those that are being analyzed and have not been classified into a category as yet.
| Cookie | Duration | Description |
|---|---|---|
| CONSENT | 16 years 9 months 3 days 8 hours | No description |
| serverTime | session | No description |
| sessionExpiry | session | No description |
| WebAppSettingsEmodnet | 2 hours | No description |
| wp-resetpass-9f786e0e8d21168d4183f3a0feb9e719 | past | No description |