Description of the infrastructure
The European Marine Ecosystem Observatory ( EMECO) is a consortium of organisations with responsibility for both monitoring and assessment of status, and also for improving understanding through research of European shelf-seas. Design and development of the EMECO Datatools began in 2007 as a suite of web based services for the regional North Sea and Irish Sea. The tools enable rapid integration and visualisation of multi-platform, multi-parameter and multi-national data. Outputs are available in the form of maps (KML and bespoke assessment maps), data (XML and CSV) and time series charts. Since 2010, the they have been developed further to include a tool kit for producing semi-automated environmental assessments with specific assessment and reporting functionality designed to meet policy requirements at National and European levels. The purpose of the Datatools is to deliver high level information products in a transparent and auditable manner that increases confidence, availability and uptake of in situ and remote sensing observational data.
Description of the Service Access
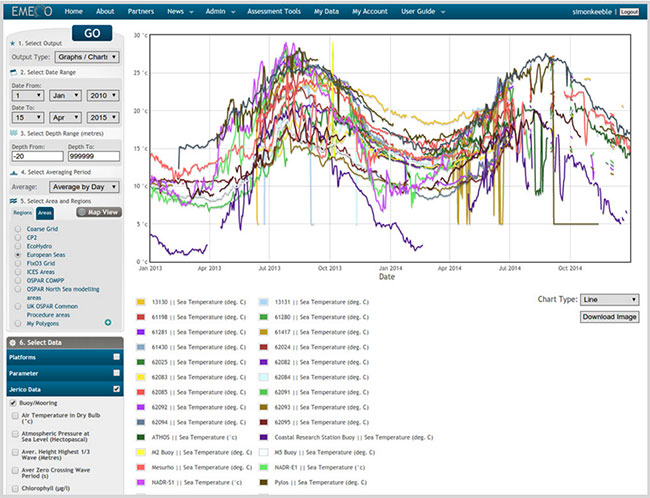
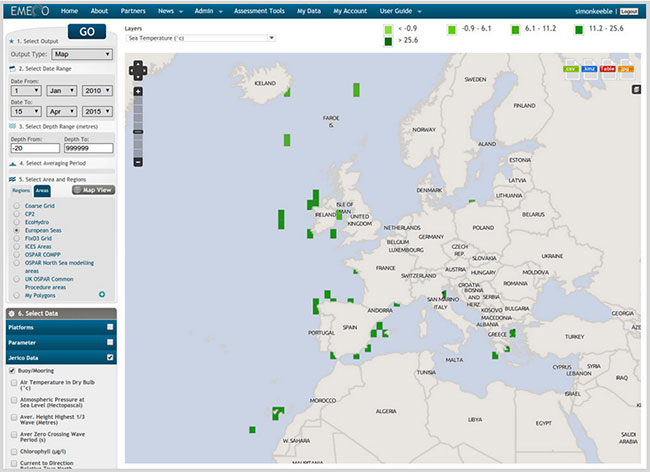
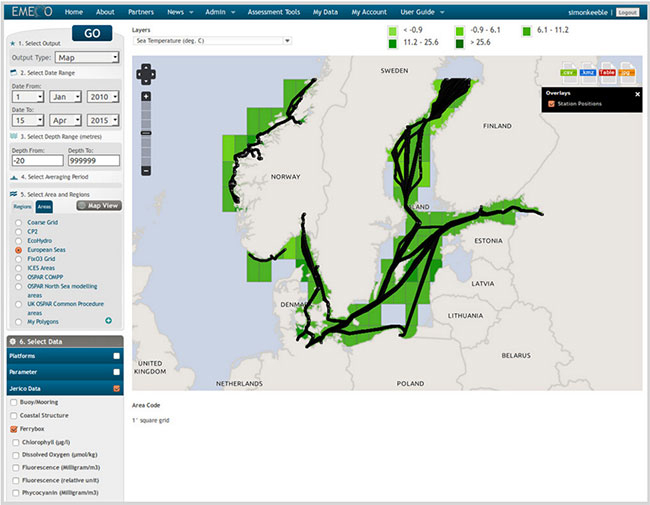
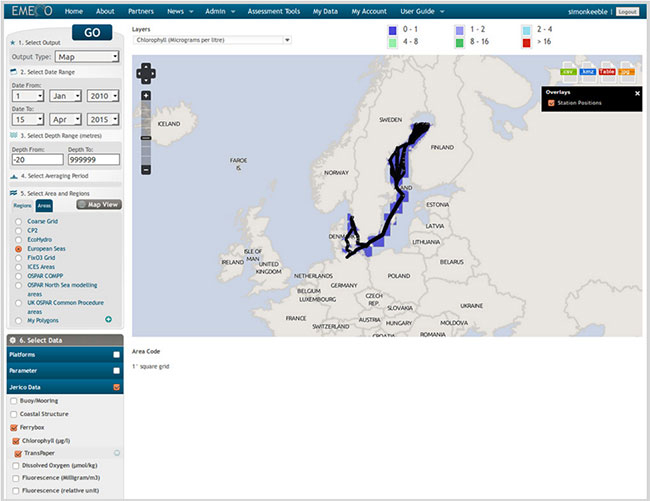
During the period of Service Access, Jerico data has been available on the EMECO Datatools. The data is available at a pan-European scale and include almost 40 parameters from a variety of coastal observing platforms including buoys and moorings, coastal structures, FerryBoxes, Ships of Opportunity (SOOPS) and tide gauges. Example outputs are provided in Figures 1-4.