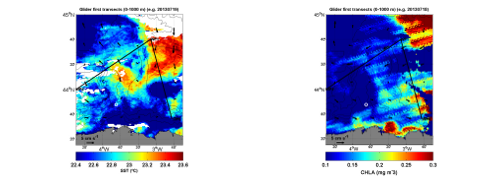
Figure 4. (Left) Sea surface temperature map of the study area on 19 July 2013, with geostrophic currents (black arrows) and the waypoints and first two transects of the mission (black lines). (Right) Chlorophyll-a map of the study area on 18 July 2013, with geostrophic currents (black arrows) and the waypoints and first two transects of the mission